:حل تمرین
.
.
%diffrent K value
%for p=0 and p=2
clc;clear;close all
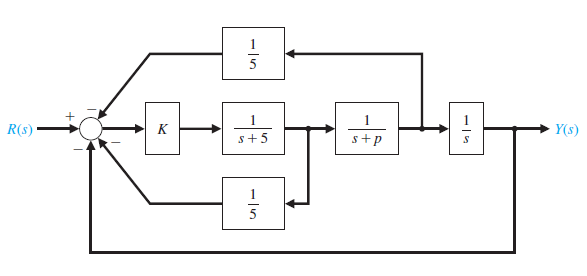
for K=[0.1 1 10]
P=2;
num1=[K]; den1=[1]; G1=tf(num1,den1)
num2=[1]; den2=[1 5]; G2=tf(num2,den2)
num3=[1]; den3=[1 P]; G3=tf(num3,den3)
num4=[1]; den4=[1 0]; G4=tf(num4,den4)
H1=0.2; H2=0.2;
G12=series(G1,G2) ; G12H1=feedback(G12,H2); G12H13=series(G12H1,G3) ; GTH1=feedback(G12H13,H1) ; GTH14=series(GTH1,G4) ; GF=feedback(GTH14,1)
t0=0 ; tfinal=10; n=500;
T=linspace(t0,tfinal,n);
u1=T;
[y1,t1]=impulse(GF,T);
[y2,t2]=step(GF,T);
[y3,t3]=lsim(GF,u1,T);
subplot(2,2,1)
plot(t1,y1)
legend('K1=0.1', 'K2=1', 'K3=10')
title('Closed Loop System Impulse Resonse');
xlabel('Time (seconds)')
ylabel('Amplitude')
grid on
hold on
subplot(2,2,2)
plot(t2,y2)
legend('K1=0.1', 'K2=1', 'K3=10')
title('Closed Loop System Step Resonse');
xlabel('Time (seconds)')
ylabel('Amplitude')
grid on
hold on
subplot(2,2,3)
plot(t3,y3)
legend('K1=0.1', 'K2=1', 'K3=10')
title('Closed Loop System Ramp Resonse');
xlabel('Time (seconds)')
ylabel('Amplitude')
grid on
hold on
end


دیدگاهها
هیچ نظری هنوز ثبت نشده است.